
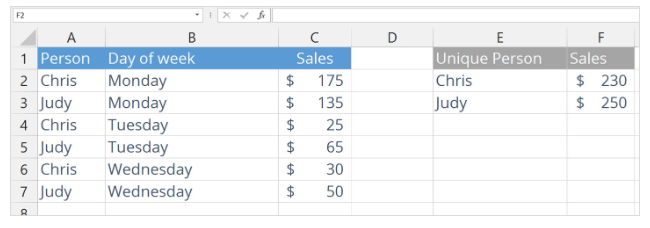
One of the most common uses of a pivot table in Excel is to aggregate data, for example calculating total sales for each person in a list: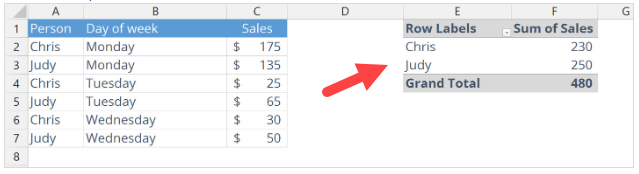
Aggregating data in your process in SolveXia can be achieved using the Aggregate data instruction. This instruction allows you to the sum, count or average values in a table. Using the example in the screenshot above, this guide will show you how to use the Aggregate data instruction.
For the purposes of this guide, assume an Excel workbook called “Sales Data.xlsx” has been uploaded to a process in SolveXia. The “weekly sales” worksheet in the file contains:
- A list of people, weekdays and their sales for each day (source); and
- A space to aggregate total sales per person (target)
Step-by-step guide
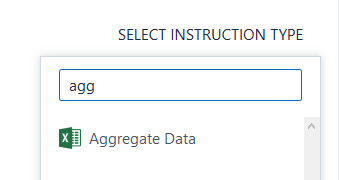
1. Add a Manipulate Data action step to the process and select the Aggregate data instruction:
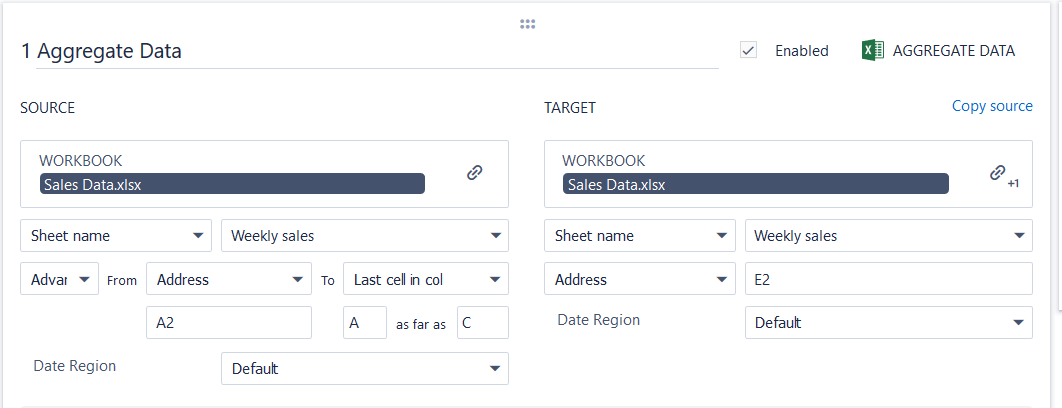
2. Link Sales Data.xlsx as the source file and configure the column containing people’s names as the source cell range – that is Cell A2 to the last cell in column A (as per the original screenshot)
3. Link Sales Data.xlsx as the target file and configure cell E2 as the target cell range (as per the original screenshot)
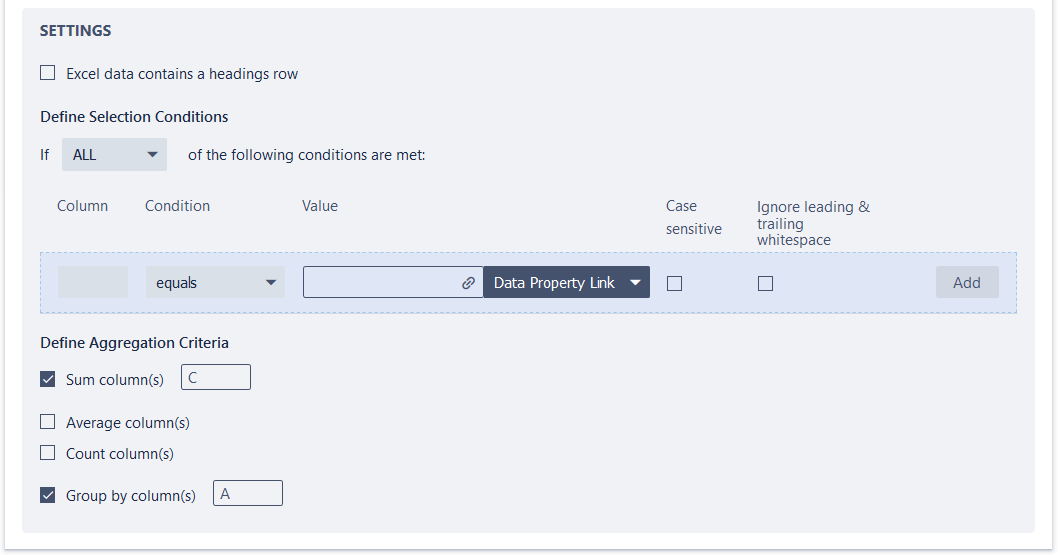
5. In the settings section, configure the column to be summed and the column the grouping will be based on. In this example, columns C and A, respectively.
6. Save and run the step. The target range should now show the aggregation:
Comments
0 comments
Please sign in to leave a comment.